home libri books Fumetti ebook dvd top ten sconti 0 Carrello


Torna Indietro

lesik sally a. - applied statistical inference with minitab®, second edition

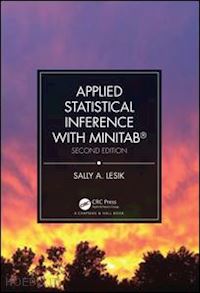
Applied Statistical Inference with MINITAB®, Second Edition


Disponibilità: Normalmente disponibile in 20 giorni
A causa di problematiche nell'approvvigionamento legate alla Brexit sono possibili ritardi nelle consegne.


PREZZO
149,98 €
NICEPRICE
142,48 €
SCONTO
5%


Questo prodotto usufruisce delle SPEDIZIONI GRATIS
selezionando l'opzione Corriere Veloce in fase di ordine.


Pagabile anche con Carta della cultura giovani e del merito, 18App Bonus Cultura e Carta del Docente


Facebook Twitter Aggiungi commento


Spese Gratis

Dettagli

Genere:Libro
Lingua: Inglese
Pubblicazione: 12/2018
Edizione: Edizione nuova, 2° edizione


Note Editore

Praise for the first edition: "One of my biggest complaints when I teach introductory statistics classes is that it takes me most of the semester to get to the good stuff—inferential statistics. The author manages to do this very quickly….if one were looking for a book that efficiently covers basic statistical methodology and also introduces statistical software [this text] fits the bill." -The American Statistician Applied Statistical Inference with MINITAB, Second Edition distinguishes itself from other introductory statistics textbooks by focusing on the applications of statistics without compromising mathematical rigor. It presents the material in a seamless step-by-step approach so that readers are first introduced to a topic, given the details of the underlying mathematical foundations along with a detailed description of how to interpret the findings, and are shown how to use the statistical software program Minitab to perform the same analysis. Gives readers a solid foundation in how to apply many different statistical methods. MINITAB is fully integrated throughout the text. Includes fully worked out examples so students can easily follow the calculations. Presents many new topics such as one- and two-sample variances, one- and two-sample Poisson rates, and more nonparametric statistics. Features mostly new exercises as well as the addition of Best Practices sections that describe some common pitfalls and provide some practical advice on statistical inference. This book is written to be user-friendly for students and practitioners who are not experts in statistics, but who want to gain a solid understanding of basic statistical inference. This book is oriented towards the practical use of statistics. The examples, discussions, and exercises are based on data and scenarios that are common to students in their everyday lives.


Sommario

Chapter 1 Introduction What is Statistics? What This Book Is About Summary Tables and Graphical Displays Descriptive Representations of Data Inferential Statistics Populations Different Ways to Collect Data Types of Variables Scales of Variables Types of Analyses Entering Data into Minitab Best Practices Chapter 2 Graphs and Charts Introduction Frequency Distributions and Histograms Using Minitab to Create Histograms Stem-and-Leaf Plots Using Minitab to Create Stem-and-Leaf Plots Bar Charts Using Minitab to Create a Bar Chart Boxplots Using Minitab to Create Boxplots Scatter Plots Using Minitab to Create Scatter Plots Marginal Plots Using Minitab to Create Marginal Plots Matrix Plots Using Minitab to Create a Matrix Plot Best Practices Chapter 3 Descriptive Representations of Data and Random Variables Introduction Descriptive Statistics Measures of Central Tendency Measures of Variability Using Minitab to Calculate Descriptive Statistics More on Statistical Inference Discrete Random Variables Sampling Distributions Continuous Random Variables The Standard Normal Distribution Non-Standard Normal Distributions Other Discrete and Continuous Probability Distributions The Binomial Distribution The Poisson Distribution The t-Distribution The Chi-Square Distribution The F-Distribution Using MINTIAB to Graph Probability Distributions Chapter 4 Statistical Inference for One Sample Introduction Confidence Intervals Using Minitab to Calculate Confidence Intervals for a Population Mean Hypothesis Testing: A One-Sample t-Test for a Population Mean Using Minitab for a One-Sample t-Test Power Analysis for a One-Sample t-Test Using Minitab for a Power Analysis for a One-Sample t-Test Confidence Intervals and Hypothesis Tests for One Proportion Using Minitab for a One-Sample Proportion Power Analysis for a One-Sample Proportion Confidence Intervals and Hypothesis Tests for One-Sample Variance Confidence Intervals for One-Sample Variance Hypothesis Tests for One-Sample Variance Using Minitab for One-Sample Variance Power Analysis for One-Sample Variance Confidence Intervals for One-Sample Count Data Using Minitab to Calculate Confidence Intervals for a One-Sample Count Variable Hypothesis Test for a One-Sample Sample Count Variable Using Minitab to Conduct a Hypothesis Test for a One-Sample Count Variable Using Minitab for a Power Analysis for a One-Sample Poisson A Note About One- and Two-Tailed Hypothesis Tests Chapter 5 Statistical Inference for Two-Samples Introduction Confidence Interval for the Difference between Two Means Using Minitab to Calculate a Confidence Interval for the Difference between Two Means Hypothesis Tests for the Difference between Two Means Using Minitab to Test the Difference between Two Means Using Minitab to Create an Interval Plot Using Minitab for a Power Analysis for a Two-Sample t-Test Paired Confidence Interval and t-Test Using Minitab for a Paired Confidence Interval and t-Test Differences Between Two Proportions Using Minitab for Two-Sample Proportion Confidence Intervals and Hypothesis Tests Power Analysis for a Two-Sample Proportion Confidence Intervals and Hypothesis Tests for Two Variances Using Minitab for Testing Two Sample Variances Power Analysis for a Two-Sample Variances Confidence Intervals and Hypothesis Tests for Two Count Variables Using Minitab for a Two-Sample Poisson Power Analysis for a -Sample Poisson Rate Best Practices Chapter 6 Simple Linear Regression Introduction The Simple Linear Regression Model Model Assumptions for Simple Linear Regression Finding the Equation of the Line of Best Fit Using Minitab for Simple Linear Regression Standard Errors for Estimated Regression Parameters Inferences about the Population Regression Parameters Using Minitab to Test the Population Slope Parameter Confidence Intervals for the Mean Response for a Specific Value of the Predictor Variable Prediction Intervals for a Response for a Specific Value of the Predictor Variable Using Minitab to Find Confidence and Prediction Intervals Chapter 7 More on Simple Linear Regression Introduction The Coefficient of Determination Using Minitab to Find the Coefficient of Determination The Coefficient of Correlation Correlation Inference Using Minitab for Correlation Analysis Assessing Linear Regression Model Assumptions Using Minitab to Create Exploratory Plots of Residuals A Formal Test of the Normality Assumption Using Minitab for the Ryan–Joiner Test Assessing Outliers Assessing Outliers: Leverage Values Using Minitab to Calculate Leverage Values Assessing Outliers: Standardized Residuals Using Minitab to Calculate Standardized Residuals Assessing Outliers: Cook’s Distances Using Minitab to Find Cook’s Distances How to Deal with Outliers Chapter 8 Multiple Regression Analysis Introduction Basics of Multiple Regression Analysis Using Minitab to Create Matrix Plots Using Minitab for Multiple Regression The Coefficient of Determination for Multiple Regression Analysis of Variance Table Testing Individual Population Regression Parameters Using Minitab to Test Individual Regression Parameters Multicollinearity Variance Inflation Factors Using Minitab to Calculate Variance Inflation Factors Multiple Regression Model Assumptions Using Minitab to Check Multiple Regression Model Assumptions Chapter 9 More on Multiple Regression Introduction Using Categorical Predictor Variables Using Minitab for Categorical Predictor Variables Adjusted Best Subsets Regression Using Minitab for Best Subsets Regression Confidence and Prediction Intervals for Multiple Regression Using Minitab to Calculate Confidence and Prediction Intervals for a Multiple Regression Analysis Assessing Outliers Chapter 10 Analysis of Variance (ANOVA) Introduction Basic Experimental Design One-Way ANOVA One-Way ANOVA Model Assumptions Assumption of Constant Variance Normality Assumption Using Minitab for One-Way ANOVAs Multiple Comparison Techniques Using Minitab for Multiple Comparisons Power Analysis and One-Way ANOVA Chapter 11 Nonparametric Statistics Introduction Wilcoxon Signed-Rank Test Using Minitab for the Wilcoxon Signed-Rank Test The Mann-Whitney Test Using Minitab for the Mann-Whitney Test Kruskal–Wallis Test Using Minitab for the Kruskal–Wallis Test Chapter 12 Two Way Analysis of Variance and Basic Time Series Two-Way Analysis of Variance Using Minitab for a Two-Way ANOVA Basic Time Series Analysis


Autore

Sally A. Lesik is a professor of mathematics at Central Connecticut State University. Dr. Lesik has taught many mathematics, statistics, engineering, and physics courses. Her primary research is in applied statistical inference. .


Altre Informazioni

ISBN:

9781498779982

Condizione: Nuovo
Dimensioni: 10 x 7 in Ø 2.40 lb
Formato: Copertina rigida
Illustration Notes:900 b/w images and 153 tables
Pagine Arabe: 496


Dicono di noi